Patient Surveys
Patient Survey Results (Practice level) February 2024 - March 2026
Extracts from practice-level patient surveys, sent to a representative sample who have attended the practice within one month of the selected dates below. On average, the completion rate was excellent in comparison with the National Patient Survey and thank you to everyone who has responded. For example, the completion rate for the National Survey 2025 was 116 responses, and for the practice level surveys on average 352 responses per survey, which reflects an excellent uptake for the practice level survey(s).
| Feb-24 | Jul-24 | Dec-24 | Mar-25 | Jun-25 | Sep-25 | Dec-25 | Mar-26 | |
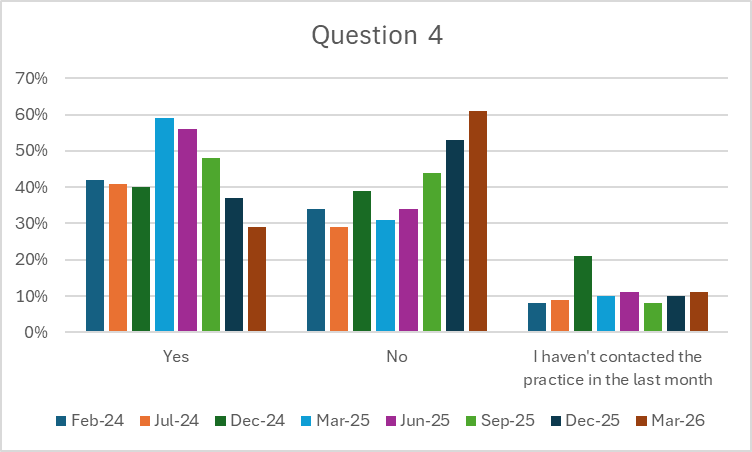
| Q 4. In the last month, have you tried to contact the practice / submit an online triage from and been told that the triage system is closed and to call back / submit a triage form the next day? | ||||||||
| Yes | 42% | 41% | 40% | 59% | 56% | 48% | 37% | 29% |
| No | 34% | 29% | 39% | 31% | 34% | 44% | 53% | 61% |
| I haven't contacted the practice in the last month | 8% | 9% | 21% | 10% | 11% | 8% | 10% | 11% |
| Feb-24 | Jul-24 | Dec-24 | Mar-25 | Jun-25 | Sep-25 | Dec-25 | Mar-26 | |
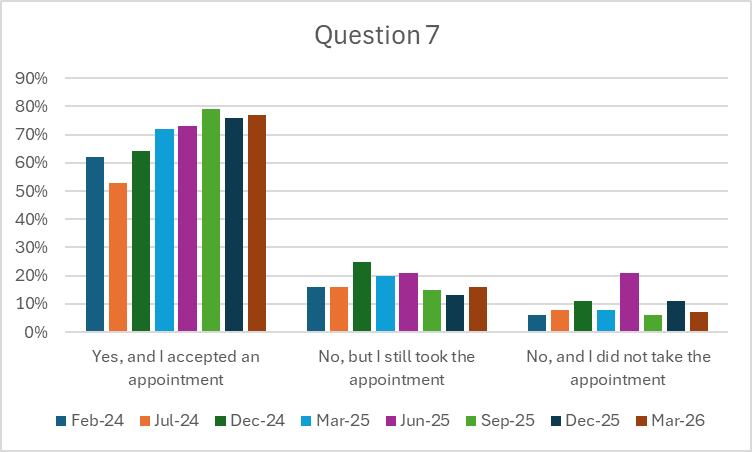
| Q. 7 Were you satified with the appointment options you were offered when you most recently contacted Riverside Medical Practice | ||||||||
| Yes, and I accepted an appointment | 62% | 53% | 64% | 72% | 73% | 79% | 76% | 77% |
| No, but I still took the appointment | 16% | 16% | 25% | 20% | 21% | 15% | 13% | 16% |
| No, and I did not take the appointment | 6% | 8% | 11% | 8% | 21% | 6% | 11% | 7% |
| Feb-24 | Jul-24 | Dec-24 | Mar-25 | Jun-25 | Sep-25 | Dec-25 | Mar-26 | |
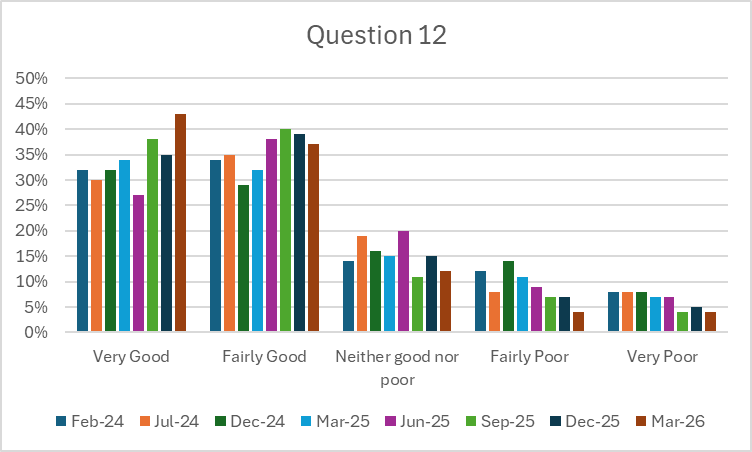
| Q 12 Overall, how would you describe your experience of Riverside Medical Practice | ||||||||
| Very Good | 32% | 30% | 32% | 34% | 27% | 38% | 35% | 43% |
| Fairly Good | 34% | 35% | 29% | 32% | 38% | 40% | 39% | 37% |
| Neither good nor poor | 14% | 19% | 16% | 15% | 20% | 11% | 15% | 12% |
| Fairly Poor | 12% | 8% | 14% | 11% | 9% | 7% | 7% | 4% |
| Very Poor | 8% | 8% | 8% | 7% | 7% | 4% | 5% | 4% |
Page last reviewed: 29 April 2026
Page created: 07 May 2025
Page created: 07 May 2025